Friday, July 29, 2011

Tableau Public Sportz Viz Entry

Below is my entry in Tableau's sportz visualization contest (http://www.tableausoftware.com/public/sports-viz-contest). For my entry, I entered every offensive play from the 2010 Nebraska football team into a database to see what might be interesting that you wouldn't see in the game by game summarized box scores. While I spent way too much time entering the data and not enough time visualizing it, this was a good exercise for the upcoming season, which I plan to do a similar analysis week-to-week. It's way easier to enter 1 game's worth of data than 14 at one time.

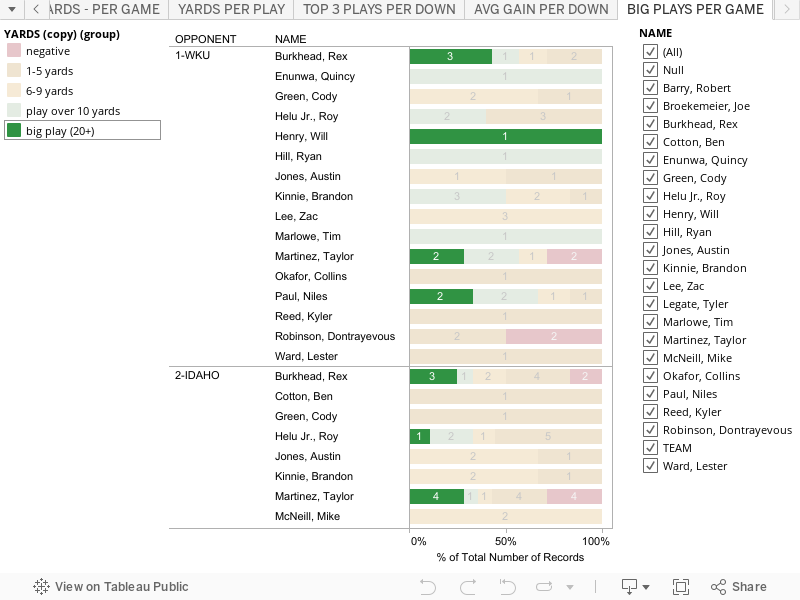
While I won't go into too much detail about all the tabs right now, I did find some interesting information, such as Rex Burkhead led the team in total percentage of offensive yards 5 of the last 6 games and that on 3rd down at home, Nebraska rushed for over 3 times more yards per rush to the right side compared to the left side.


While it's not as good as I would have liked since I put too much time into collecting the data and I know it won't win, I had fun doing it, and that's the main point, and Tableau really makes it fun to analyze data. My next steps will be to dig a little deeper into the data, and hopefully continue this on a week to week basis creating a new viz for each game.


First post

Hi, testing out the new blog. This is where I will be posting my visualizing of sports data, mainly Huskers stats using http://www.tableausoftware.com/public. They're having a sports viz contest, will be posting my entry shortly.