Sunday, November 30, 2014

2014 COACHING SEARCH DASHBOARD

Didn't think I need to create this post this year after the Huskers won in Iowa City, but here we are. Below is a dashboard I built using Tableau that combines coaching info from www.coachinghotseat.com and advanced stats from www.footballoutsiders.com

You can use the filters on the right to drill down the candidates that fit your criteria.  On the bottom is a chart that you can use to compare coaches on any two metrics included in the drop down boxes. 

Friday, June 6, 2014

Coaching Salaries and Stipends

After hearing about Nick Saban's new contract information being released, along with the continuing discussion around paying NCAA players a stipend on top of their scholarships, I was curious how long it would take coaches to earn enough to pay a $2000 stipend for each scholarship player on their roster. Using salary information from coacheshotseat.com, below are the results.

 So if Alabama makes into the semifinals this year, Nick Saban would earn enough money between the Jan 1 semifinal and noon on Jan 9th to pay each players' stipend for the entire year. This isn't to demonize the coach's salaries, as they are essentially CEOs of multi-millionare corporations, and I'm sure that Nick Saban would gladly spend 2.3% of his yearly income to help provide for his players. It may be harder for coaches like Dan Enos of Central Michigan to contribute 45% of his income to provide the same benefit for his players in the MAC.

But overall, this shows that for the major conferences, saying there isn't money in college athletics to help pay a stipend is being disingenuous.


Thursday, October 31, 2013

Coaching Search Dashboard

Here is a visualization looking at current coaching performance and comparing it to Nebraska over the last 6 years, Bo's tenure.

Wednesday, August 22, 2012

POSSIBLE PUNT YARDS

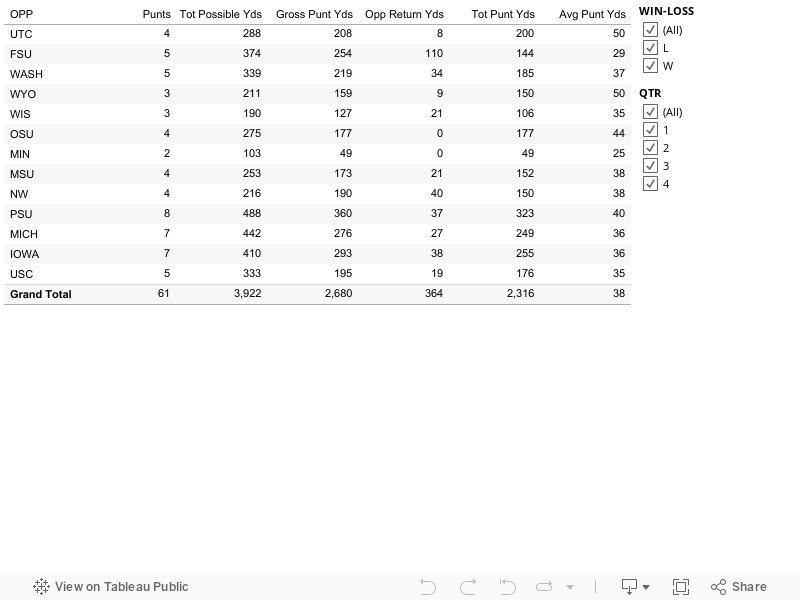
I recently finished a project that loaded all 2011 Nebraska Cornhusker offensive stats in a database, so I could further analyze and visualize them using Tableau. One of the questions I had with the data is about a small but important part of the game, punting. Watching the 2010 season when Alex Henery was punting, I thought he did a great job controlling field position, but didn't show up in the stats, because he was always seemed to be punting from our side of the 50 yardline.

 I always thought there should a better metric than punts down inside the 20. Perhaps this has already been done, but I calculated a new metric for punters, called Possible Punt Yards (for now until I think of a better name). It takes the total possible yards they could punt, minus return yards, to get a possible punt percentage. So if you are punting from the 50, there are 50 possible yards, and if you give up a 10 yard return, you're PPY% would be 80% (50-10/50).

 Looking at the 2011 season, Brett Maher had a 60.54%, which is pretty good. Don't know if it made a difference, but in losses his PPY% was 3% less than in wins. It definitely made a difference in the NW game, as he punted a remarkable 89% gross possible yards, but gave up 40 return yards, which were key in a close game. I have the 2010 stats somewhere as well, will have to do a comparison with Alex Henery to see how is PPY% looked compared to Maher.


Wednesday, August 10, 2011

Big Ten Standings Prediction

Since everyone is coming out with their conference predictions this time of year, I thought I'd try to do the same, with a different methodology. Instead of making an educated guess, I used trends from the past 3 years to make my predictions, a very rudimentary predictive analytics. For example, Michigan won 3 games in 2008, 5 in 2009, and 7 again in 2010, for average improvement of 1.33 games a season. Since you can't win only a quarter or 2 quarters of a game (unless you ask Missouri fans in 2009), I rounded down to 1, for a projection of 8 wins this season.

While this method is obviously flawed, as teams who lost a lot of games have more room to move up, it still is pretty close to what most predictions are for the season. It looks like it will be Michigan St. versus Ohio St. for the inaugural Big Ten title game if past trends continue into this season.


Monday, August 8, 2011

Total Yards for 2010 - The Great Divide


Since Nebraska lost a lot of offensive NFL talent after last year (Roy Helu and Niles Paul to the Redskins, McNeil to the Colts), the biggest concern a lot of people have is who will replace those yards this season. However, looking at this chart, a bigger questions should be, how will we spread out the yards. As you can see, 3 players got the majority of rushing and receiving yards, Helu, Burkhead, and Martinez. But this was often a feast or famine situation, as if you shut down 2 of them (or all 3) then we weren't going to move the ball.

I'll be intersted in seeing how we spread the ball out this year and who steps up to fill in for the departed players. My guess is will players who weren't on the team last year, like Braylon Heard and Jamal Turner.


Tuesday, August 2, 2011

Big Plays 2010

Everyone talks about how important big plays are in a team's offense, here's a vizualization of big plays (plays that gain 20+ yards) versus negative (plays that gain zero or less yards) on a game-by-game basis for the main offensive threats.

Looking at the numbers, in the 4 losses, we had at least 13 negative yardage plays (16 or more against A&M, OU, and Washington in the bowl). As for big plays, we only had 12 in our 4 losses, compared to an astounding 65 negative plays in those same games.

Comparatively, we had almost 5 big plays per game in our wins, with only an average of 7 negative plays per win. So while are many factors that play into winning a losing the game, as you can see here, minimizing the number of negative plays you have will really help increase your chances of winning the game (not that you needed this vizualization to tell you that).